 |
| |
|
|
|
Click
on a Topic Below |
| Home» Impacts |
|
|
| Climate Impacts |
Previous: Climate Science |
| Projected Effect | Probability estimate | Examples of Projected Impacts with high confidence of occurrence (67 – 95% probability) in at least some areas |
| Higher maximum temperatures, more hot days and heat waves over nearly all land areas | Very likely (90-99%) | Increased deaths and serious illness in older age groups and urban poor Increased heat stress in livestock and wildlife Shift in tourist destinations Increased risk of damage to a number of crops Increased electric cooling demand and reduced energy supply reliability |
| Higher minimum temperatures, fewer cold days, frost days and cold waves over nearly all land areas | Very likely (90-99%) | Decreased cold-related human morbidity and mortality Decreased risk of damage to a number of crops, and increased risk to others Extended range and activity of some pest and disease vectors Reduced heating energy demand |
| More intense precipitation events | Very likely (90-99%) over many areas | Increased flood, landslide, avalanche, and mudslide damage Increased soil erosion Increased flood runoff increasing recharge of some floodplain aquifers Increased pressure on government and private flood insurance systems and disaster relief |
| Increased summer drying over most mid-latitude continental interiors and associated risk of drought | Likely (67-90%) | Decreased crop yields Increased damage to building foundations caused by ground shrinkage Decreased water resource quantity and quality Increased risk of forest fire |
| Increase in tropical cyclone peak wind intensities, mean and peak precipitation intensities | Likely (67-90%) over some areas | Increased risks to human life, risk of infectious disease epidemics and many other risks Increased coastal erosion and damage to coastal buildings and infrastructure Increased damage to coastal ecosystems such as coral reefs and mangroves |
| Intensified droughts and floods associated with El Niño events in many different regions | Likely (67-90%) | Decreased agricultural and rangeland productivity in drought- and flood-prone regions Decreased hydropower potential in drought-prone regions |
| Increased Asian summer monsoon precipitation variability | Likely (67-90%) | Increase in flood and drought magnitude and damages in temperate and tropical Asia |
| Increased intensity of mid-latitude storms | Uncertain (current models disagree) | Increased risks to human life and health Increased property and infrastructure losses Increased damage to coastal ecosystems |
A pioneering study presented another kind of climatic extreme — runs of abnormally warm or cold weather, which are well known to correlate with crop damage, wildfires, etc. (see, e.g., Mearns, Katz and Schneider, 1984). This study first analyzed the likelihood of long runs of abnormal weather in central England, where there is a uniquely long — 400 years — temperature record. Then, more recently, Jean Palutikof of the Tyndall Center at the University of East Anglia, compared the observed data to that of one version of the Hadley Center's climate model, which is often used to project climate change. As the England temperature record figure shows, there is a very high correlation between the actual observed temperatures in central England and the grid box in the Hadley model representing central England. Palutikof goes on to calculate the probabilities for such runs of extremes occurring in the future using the Hadley Center model for a global warming scenario. (Results are also depicted on the graphs.) Notice the very large increase in the likelihood of warm temperature extremes, and the decreasing likelihood of colder spells of weather. This is similar to what IPCC anticipated in Projected Effects of Global Warming, but in this case, this model variability is validated against central England's long historical temperature record. To evaluate impacts and the likelihood of “dangerous” climatic changes, extreme events are among the variables that must be considered.
Figure — Analysis of a 400 year long central England temperature record and the Hadley Center Hadcm3 climate model for intense winter cold spells and intense summer hot spells. (Source: Palukitof, Climate Research Unit, UEA).
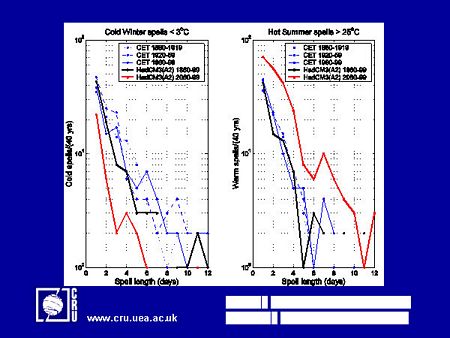
Note the remarkable agreement between the model's characterization of the likelihood of temperature extremes (thick black lines on the England temperature record) and the actual temperature extremes observed in central England (blue lines on the England temperature record). Given this excellent validation exercise, Jean Palutikof then added red lines — the model's projections to 2080-2099 driven by the A2 SRES scenario. The results show, perhaps not surprisingly, a decrease in intense cold spells and a simultaneous increase in hot spells. Rising temperatures across Europe, and specifically, Europe's deadly summer 2003 heatwave, suggest that Palutikof's projections trend in the right direction.
Five Numeraires. Another reason for some of the large range of future climate scenarios projected in the Nordhaus survey is due to the differences in perception between economists, other social scientists, and natural scientists regarding the fraction of damages coming from non-market categories. Roughgarden and Schneider (1999) analyzed the Nordhaus (1994a) data set and found that most respondents who had estimated large damages were natural scientists who had placed the bulk of their estimated damages in the non-market basket. The economists, on the other hand, tended to have smaller overall damage estimates and fewer non-market-related costs. (See Probability distributions (f(x)) of climate damages.) This raises a major issue about the dimensions of damages, which, I have argued, need even finer subdivision than the binary characterization of market and non-market. Schneider, Kuntz-Duriseti and Azar (2000) have separated out “Five Numeraires” of climate impact (see the box below): monetary loss (market category), loss of life, quality of life (including coercion to migrate, conflict over resources, cultural diversity, loss of cultural heritage sites, etc.), species or biodiversity loss, and distribution/equity (e.g., longer growing seasons from warming increasing production in richer northern countries while crop losses occur in poorer 'overheated' tropical countries). There is little agreement on how to place a dollar value on the non-market impacts of climate change, such as an increase in the gap between rich and poor, the loss of human life, biodiversity, or ecosystem services, but this does not mean that these numeraires should be ignored.
While many developing countries may not experience as much absolute dollar loss in the market category as developed countries, they are likely to experience more human suffering and mortality. Already, developing countries are more affected by natural disasters, both in terms of frequency and severity. In fact, Perrings (2003) states that in the 1990s, 94% of all natural disasters and 97% of deaths related to such disasters occurred in what he calls "low-income countries", with about two thirds of those deaths occurring in southeast Asia alone. These statistics support the use of alternative numeraires for calculating damages.
On a related subject, the last numeraire, the issue of equity in climate change is and will likely continue to be contentious. Climate change inequality will likely come in two forms. First, it will produce inequity in effects. Some countries or sectors within countries will benefit from a certain degree of warming, whereas others will be harmed by it. The developed countries, who are responsible for most of the greenhouse gases emitted into the atmosphere thus far, may not be affected as much as the developing countries for two reasons: First, there is usually higher adaptive capacity in richer, cooler countries than in poorer, warmer ones. Second, developing countries that have not yet experienced many of the economic fruits of the Victorian Industrial Revolution, and want their chance to emit and industrialize, fear that policies to restrict emissions will deny them their “fair share” of the atmospheric commons to use—quite literally—as a waste dump. One strategy to solve this problem is “technology leapfrogging,” the transfer or development of cleaner technologies to developing countries on a much-accelerated time schedule (relative to the slow developments that have emerged over the twentieth century in now-rich countries). Moreover, as there are disparities in countries’ abilities to pay for global warming-related problems, once again, the developing countries will be impacted more yet have less of an ability to pay than the rich nations. (See Regional Impacts.)
Box — The Five Numeraires (source: Schneider, Kuntz-Duriseti and Azar 2000)
Despite this, any comprehensive attempt to evaluate the societal value of damages (or benefits) from climate change should include such things as loss of species diversity, loss of coastline from increasing sea level, environmentally-induced displacement or death of persons (see “Scientists report global warming kills 160,000 annually”), change in income distributions, and agricultural losses. The environment also possesses intrinsic worth that does not carry a clear market value, such as its aesthetic appeal, which suggests that it should be treated as an independent variable in utility. We should consider the “existence value” of the environment (i.e., stewardship) and place a priority on preserving it, even if we don’t intend to personally experience it. This is in addition to the “option value” of the environment: we may want to preserve it for our — or our grandchildren’s — possible personal use in the future.
Thus far, our discussion of climate change effects has been largely anthropocentrically-focused. However, species other than humans are also affected by global warming, as the five numeraires suggest. In some ways, this is more concerning, as natural systems have limited adaptive capacity and are expected to be less resilient than social systems -- particularly for rapid changes for which all but micro-species generally have no evolutionary mechanism to adapt quickly. In addition, natural systems will likely be the most undeserving victims of future climate change, as they obviously have no influence on the policymaking process, except to the extent that humans value their services and survival.
Scientists have already detected that the approximately 0.7oC of warming that has occurred on Earth since the mid-1800s is having a discernible effect on various ecosystems. Root and Schneider, 2002 reported that the ranges of the species they researched were moving poleward, up mountain slopes, or both. They also found a strong pattern of consistent shifting towards earlier spring activities occurring in many of the species investigated. Their early findings were supported by futher work by that team (Root et al., 2003) and by Parmesan and Yohe, 2003, who, after analyzing more than 1,700 species, detected habitat shifts towards the poles (or vertically upward) averaging about 6.1 km per decade, as well as the advancement of typical spring activities by 2.3 days per decade.
Furthermore, ecological systems are more likely to be affected than human ones if/when thresholds are exceeded. Scientists have identified various "geoboundaries", locations such as coastlines and mountaintops that are more prone than other areas to irreversible losses. If these areas become unsuitable for their present occupants of disappear altogether, many of the plant and animal species that dwell there will be unable to find suitable alternative habitats, making extinction much more probable (e.g., Thomas et al., 2004).
The severity of the effects of climate change will vary among species, implying a dismantling of existing plant and animal communities as individual species' responses to climate unfold, which could create disruptions in what Daily, 1997 terms ecosystem goods (i.e., seafood, fodder, fuel wood, timber, pharmaceutical products) and services (i.e., purification of air and water, detoxification and decomposition of wastes, climate moderation, soil fertility regeneration). Additionally, the more rapidly climate changes, the more likely there will be "no-analog" communities (e.g., see Overpeck, Webb, and Webb III, 1992 and Schneider and Root, 1998), a scenario that will likely lead to increases in endangerment and extinction.
These are a few of the reasons it is essential for any full analysis of the costs of climate change impacts or mitigation strategies to explicitly consider alternative numeraires. In a May 25, 2004 e-mail to colleagues (myself included), Stuart Pimm presented a striking analogy about the decision on which costs to include in damage estimates: "Your hotel burns down tonight, you survive, but it's a close call and you only have the chance to bring a couple of items with you as your leave. Do you take your wallet? Or the only photograph you have of you, your wife, your kids, and your now-deceased parents?" To continue the analogy, I worry that market-is-everything economists would just take hte money (i.e., fail to value non-market goods).
Any climate damage assessment must be as clear as possible about which are being used and which have been omitted. Moreover, before any aggregation is attempted — e.g., cost-benefit optimization strategies — authors should first disaggregate costs and benefits into several numeraires and then provide a “traceable account” (see Moss and Schneider) of how they were re-aggregated. Such transparency is essential given the normative nature of the valuation of various consequences, as characterized by the five numeraires.
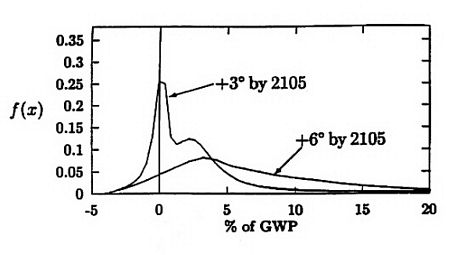
We will not easily resolve the paradigm gulf between the relatively optimistic and pessimistic views of those specialists (stereotypical economists and natural scientists, respectively) with different training, traditions, and world views. But the one thing that is clear from both the Morgan and Keith and Nordhaus studies is that the vast bulk of knowledgeable experts from a variety of fields admit to a broad umbrella of possibilities in the area of climate change — including both mild and catastrophic eventualities (see Probability distributions (f(x)) of climate damages). The wide range of probabilities follows from recognition of the many uncertainties in the data and assumptions inherent in climate models, climatic impact models, economic models, and their synthesis via integrated assessment models (see Schneider, 1997b). However, this wide range of potential future outcomes creates a risk of misinterpretation by those who are unfamiliar with the underlying issues. While it is necessary that a wide range of possible outcomes be included, they should be accompanied by subjective probabilities that knowledgeable assessment groups like the IPCC believe accompany each of those possible outcomes. Both “the end of the world” and the “it is good for business” outcomes, often polarized in media and political debates, carry very low probabilities, and the vast bulk of knowledgeable scientists and economists consider there to be a significant chance of climatic damage to both natural and social systems somewhere between these two extremes. Under these conditions — and given the unlikelihood that any amount of research will soon eliminate the large uncertainties that still persist — it is not surprising that most formal climatic impact assessments have called for cautious but positive steps both to slow down the rate at which humans modify the climatic system, to make natural and social systems more resilient to whatever changes do eventually materialize, and to mitigate some of the emissions in order to reduce the likelihood of “dangerous anthropogenic interference with the climate system” (e.g, National Academy of Sciences, 1991).
Figure — Probability distributions (f(x)) of climate damages from an expert survey in which respondents were asked to estimate tenth, fiftieth, and ninetieth percentiles of damages for the two climate change scenarios shown. Source: from Roughgarden and Schneider, 1999. Data from Nordhaus, W.D., 1994.
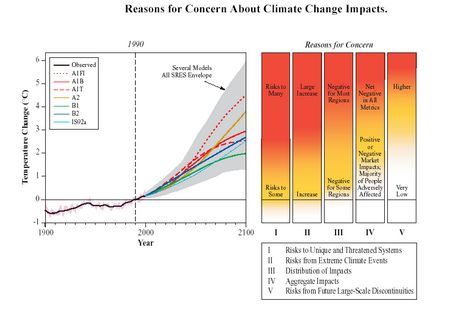
The Earth's surface temperature figure already showed the projected temperature increases up to 2100, as estimated by IPCC using two categories of models. One set of projections comes from the SRES, which gives a total of six “story line” scenarios. The vertical bars on the right hand side of that figure estimate the range of temperatures that each scenario implies. Scenario A1FI results in the highest temperatures, and A1T nearly the lowest. The second category of models determines the width of the bars. The IPCC authors used 6 GCMs, each with different climate sensitivities and different thermal delay times due to oceanic heat capacity, to calculate the range in the bars for each SRES storyline driver. The total range of warming to 2100 spans from about 1.5oC to a very large 5.8oC. But as large as this range is — implying warming that would be relatively easy to adapt to by many human systems up to potentially catastrophic warming — it is still too small to incorporate all recent climate sensitivity estimates, like those on the Single probability density function, or in Forest et al. (their Figure 4).
In fact, estimating the likelihood of the warming in 2100 requires doing more than the IPCC did in either Working Group I or the SRES. Neither provided estimates of the subjective probabilities of climate sensitivity (Working Group I), nor that of emissions (Working Group III - SRES). Thus, very different estimates of risk could be obtained by invoking different assumptions of the likelihood of various climate sensitivities and emissions. I have challenged both Working Groups to remedy this lack of probabilistic estimation in their next IPCC report, the Fourth Assessment Report — currently being called the AR4 (see “What is 'Dangerous' Climate Change?” and “Can We Estimate the Likelihood of Climatic Changes at 2100?"). But not everybody in the process agrees that we can — or even that we should try in the AR4 — to make such highly subjective probabilistic estimates of future events.
Grübler and Nakicenovic (2001), key authors of the SRES effort, responded to my call (Schneider, 2001) for probabilistic assessment of emissions and climate scenarios with a cautious “no thanks.” Indeed, these authors suggest that we are better off, as IPCC did, assigning each representative scenario the label “equally sound,” implying no distinguishing probabilities. Grübler and Nakicenovic have thus implied that a “consequences alone” definition of risk is all we can deal with, as assigning wrong probabilities would be worse than nothing (i.e., a Type I error):
So although we agree with Schneider in many respects, ‘dangerous’ levels of climate change will need to be identified by research into the adverse impacts on natural and human systems, independent of the question of how likely they are to occur, and covering the full range of scientific uncertainty. There is a danger that Schneider’s position might lead to a dismissal of uncertainty in favor of spuriously constructed ‘expert’ opinion.
Risk Equals Probability Times Consequence
Indeed, I agree that any such estimates will be highly subjective and often carry a fairly low confidence (e.g., Moss and Schneider, 2000), and this should be freely admitted and kept in mind. Moreover, these estimates will likely change over time as knowledge is gathered and reassessed. But to duck the call to produce probabilistic estimates for such scenarios is to circumvent the completion of the risk equation, where risk = probability x consequence. It is very difficult for policymakers to have a “consequences alone” definition of risk such as that seemingly advocated by Grübler and Nakicenovic, in which only ranges of plausible scenarios are given “independent of the question of how likely they are to occur.” Let me suggest that if a range of possibilities with no estimates of probabilities attached was the sole basis of the scientific input for decision-making, then we should all focus on studying and preventing the next massive asteroid from colliding with the Earth, an event whose consequences would undoubtedly be orders of magnitude worse than any other environmental event we could imagine, anthropogenic or natural. The reason we do not all redirect our efforts towards the problem of avoiding an asteroid collision is that its probability is typically given on the order of one in ten million or less per year, whereas the probability of serious climate change is obviously many orders of magnitude higher than that – likely to be in the first decimal place (many tens of percent).
Probability matters greatly in a resource-constrained world struggling to determine the relative priorities for various investments (e.g., preventing dangerous climate changes, improving health care, or providing cleaner water). Nevertheless, I agree with Grübler and Nakicenovic that the assignment of such probabilities is fraught with deep uncertainty. While risk is still probability x consequence, the probability of some level of future climate change is not directly determinable by any set of frequency experiments – so-called frequentist probabilities – so we can only rely on scientific judgments based upon as much empirical observation as is possible (see 'Mediarology'). But these empirical observations will not be of the future climate – which would be impossible in principle before the fact – but rather of the behavior of the subcomponents of a complex systems model, which are then used as our “hazy crystal balls” to make the future projections. Thus, subjective judgments – essentially Bayesian judgments about the plausibility of the assumptions and structure of the systems model — are made on the basis of empirical validation of the subcomponents of the systems model (see Climate Modeling), not the performance of the overall system in the future (as that cannot be done empirically before the fact). Empirical data can and should be used as much as possible in the construction of the elements of such systems models used to estimate future changes, and empirical testing of the whole systems model on events that have already occurred (e.g., paleoclimatic events for a climate model or oil price shocks for an economic model) is desirable when possible, although these empirical tests will rarely be perfectly analogous to the future events climatologists are asked by society to assess.
The very nature of such subjective probabilities makes them controversial, and some scientists believe it is better to offer no probabilities than subjective ones — as implied in the above quotation, for example. I strongly disagree, using the asteroid collision argument made earlier as case in point. For us simply to redefine the classical definition of risk to “consequences alone” because subjective probabilistic analysis is fraught with deep uncertainties, is in essence to offer no advice to the policy community about how it should prioritize climate change actions or policies, for without probabilities, it is very difficult to engage in risk management. If we in the scientific assessment business do not offer some explicit notions of the likelihood of projected events, then the users of our products — policy analysts and policymakers — must guess about what we think these likelihood estimates are. That is hardly preferable, in my view, to a carefully-worded and explicitly-offered set of subjective probabilistic estimates accompanied by our (often low) confidence ratings of such estimates.
Next: What is the Probability of “Dangerous” Climate Change?