 |
| | | | |
Click on a Topic Below |
| Home» Climate Science |
| |
| Climate Science Introduction |
There is a great deal of confusion among policy makers and the public (see “Mediarology”) about many aspects of the science of climate change some of which, it should be said, carry large degrees of uncertainty. However, numerous other aspects are actually scientifically well-established. This combination of high certainty and deep uncertainty is the backdrop against which we must codify our understanding into models of the climate system which include as many relevant components of the Earth atmosphere system as possible, comprising the atmosphere, oceans, snow-ice fields, and soils-ecosystems subsystems. These subsystems are represented by sub-models, which are linked into an Earth systems model, which can be used to project the possible effects and impacts of human activities on future climate — the problem confronting decision makers at all scales, from the individual level to countrywide or international scales. The Intergovernmental Panel on Climate Change (IPCC) has decomposed the overall climate change issue into three main categories, each of which is studied by an IPCC Working Group: climate science (Working Group I), climate impacts (Working Group II), and climate mitigation policy (Working Group III). In addition, a separate group — the Special Report on Emission Scenarios (SRES), which is really an offshoot of Working Group III — put together a team to produce a host of plausible scenarios of future population, economic growth, and technology in order to estimate the range of possible future emissions from human activities that may cause climate change. Analyzing the overall climate issue via scenarios, climate effects projections, climate impacts estimation, and costs of climate policy is a useful decomposition, as it makes the consequences of various levels of human-induced emissions or mitigation/adaptation responses very clear. I will follow that same decomposition in this website, briefly summarizing the main points from the IPCC Working Group reports and other sources from which more details and references can be obtained, including a chapter from a climate policy survey I co-authored with Richard Wolfson of Middlebury College (see Chapter 1 of Climate Change Policy: a Survey). I can only briefly touch on main points in the various sections of this website, but I will provide many links to other works of mine and other authors for those wishing more detailed explanations and alternative viewpoints on these complex, interconnected issues. Uncertainty is prevalent in the climate change debate |

| Problems with data
Problems with models
Other sources of uncertainty
|
The Greenhouse effect is scientifically well-established
Despite a multitude of uncertainties, some elements of the climate change debate are well-established, including the science behind the greenhouse effect. The gases that comprise Earth’s atmosphere are largely transparent to visible light. That’s obvious because we can see the sun, moon, and stars from the ground despite the gases circulating above. This explains why much incident sunlight penetrates the atmosphere and reaches the Earth's surface. There, the surface absorbs it, heats up, and then re-emits the energy as infrared radiation. But the atmosphere is not as transparent to infrared radiation. Certain naturally-occurring gases and particles — particularly clouds — absorb infrared radiation and hinder its ability to escape from Earth. The infrared energy that is trapped in the atmosphere by greenhouse gases and clouds is re-emitted, both up to space and back down towards the surface — the latter primarily adding heat to the lower layers. As a result, Earth’s surface warms further, emitting infrared radiation at a still greater rate, until the emitted radiation is in balance with the incident sunlight and the other forms of energy coming and going from the surface (e.g., evaporative losses — see the figure Details of Earth's energy balance below). Because of infrared-absorbing gases and clouds in the atmosphere, the resulting surface temperature is higher than it would be otherwise. That is what accounts for the 33 °C (60 °F) difference between the Earth’s actual surface air temperature and that which would prevail if there were no greenhouse constituents in the atmosphere.
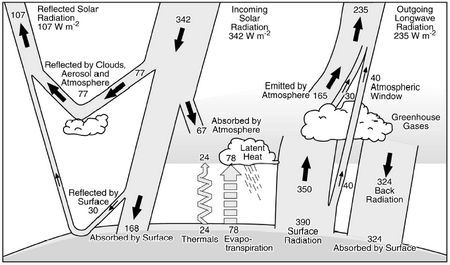
Figure — Details of Earth's energy balance (source: Kiehl and Trenberth, 1997). Numbers are in watts per square meter of Earth's surface, and some have a range of uncertainty of as much as +/- 20%. The greenhouse effect is associated with the absorption and re-radiation of energy by atmospheric greenhouse gases and particles, which results in a downward flux of infrared radiation from the atmosphere to the surface (back radiation) and therefore, a higher surface temperature. Note that the total rate at which energy leaves Earth (107 W/m2 of reflected sunlight plus 235 W/m2 of infrared [long-wave] radiation) is equal to the 342 W/m2 of incident sunlight. Thus, Earth is in approximate energy balance in this analysis.
Because the atmosphere functions, in a crude sense, like the heat-trapping glass of a greenhouse, this heating has earned the nickname "greenhouse effect," and the gases responsible are called greenhouse gases. The most important natural greenhouse gas is water vapor, followed by carbon dioxide, and, to a lesser extent, methane. (Actually, the greenhouse analogy is not such a good one; a greenhouse traps heat primarily by preventing the wholesale escape of heated air, with the blockage of infrared radiation playing only a minor role).
The 33 °C of warming due to natural greenhouse gases is known as the natural greenhouse effect, and it’s a good thing it occurs because it makes our planet much more habitable than it would be otherwise. What we’re concerned about now is the anthropogenic greenhouse effect arising from additional non-natural greenhouse gases emitted as a result of human activities. Such emissions add to the “blanket” of heat-trapping gases in the atmosphere, further increasing surface temperatures.
It’s important to understand that the basic greenhouse phenomenon is well-understood and solidly grounded in basic science. More controversial is the extent to which humans have already caused climate change and by how much we will enhance future disturbance.
It is well-established that human activities have caused increases in radiative forcing
Figure — Indicators of human influence on the atmosphere since 1000 A.D. (source: IPCC, Working Group I, Summary for Policy Makers, figure 2).
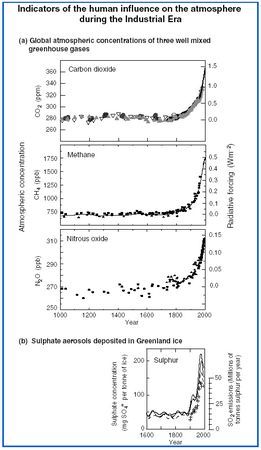
In the past few centuries, as the figure Indicators of human influence shows, atmospheric carbon dioxide has increased by more than 30 percent. According to King, 2004, the annual atmospheric concentration of carbon dioxide is currently about 372 parts per million (ppm), higher than at any other time over the last 420,000 years. The reality of this increase is undeniable, and virtually all climatologists agree that the cause is human activity, predominantly the burning of fossil fuels, which themselves were created through a very wasteful process (see “Buried losses”); to a lesser extent, deforestation and other land-use changes, along with industrial activities like cement production, also contribute to climate change. Although water vapor is the dominant greenhouse gas, its concentration, for the most part, is affected only indirectly by human-induced warming via enhanced evapotranspiration when the Earth’s surface is warmed. Carbon dioxide is the most important anthropogenic greenhouse gas that results directly in global warming, although there are some other significant heat-trapping gases and particles that can both cool and warm (see the figure Global mean radiative forcing below).
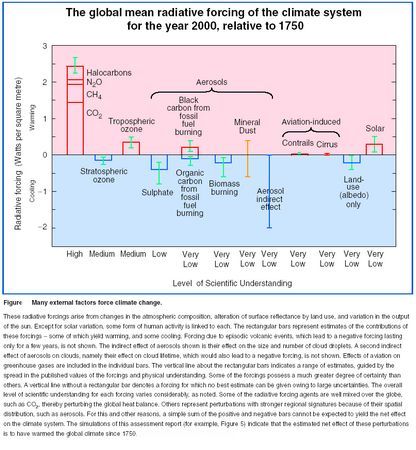
Figure — Global mean radiative forcing of the climate system for the year 2000 (source: IPCC, Working Group I, Summary for Policy Makers, figure 3).
It is well-established that the Earth’s surface air temperature has warmed significantly
Figure (a&b) — Variations of the Earth's surface temperature (source: IPCC, Working Group I, figure 1).
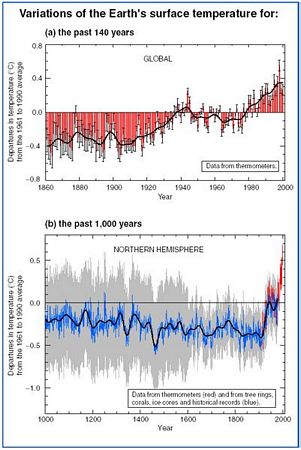
The figure Variations of the Earth's surface temperature (a) shows that Earth’s temperature is highly variable, with year-to-year changes often masking the overall rise of approximately 0.6 °C that has occurred since 1860. Nevertheless, the twentieth century upward trend is obvious. Especially noticeable is the rapid rise at the end of the twentieth century. Indeed, the period from the 1980s onwards has been the warmest period in the last 2,000 years (see Mann and Jones, 2003 and Jones and Mann, 2004). 19 of the 20 warmest years on record have occurred since 1980, the 12 warmest all since 1990. 1998 marked the all-time record high year, with 2002 and 2003 in second and third places, respectively. There is good reason to believe that the 1990s would have been even hotter, had not the eruption of Mt. Pinatubo in the Philippines put enough dust into the high atmosphere to block some incident sunlight and cause global cooling of a few tenths of a degree for several years — an event captured by current climate models (see, e.g., Hansen). Looking beyond the top ten years, Variations of the Earth's surface temperature (a) shows that the twenty warmest years on record include the entire decade of the ’90s and all but three years from the 1980s as well. Clearly, substantial warming has taken place in the recent past. Bertrand et al. (2002) have noted that only highly improbable increases in volcanic activity and decreases in solar radiation could counteract the global warming that is expected to occur in this century.
Could the warming of the last 140 years (as shown in Variations of the Earth's surface temperature (a)) be a natural occurrence? Might Earth’s climate undergo natural fluctuations that could result in the temperature records documented? Increasingly, the answer to that question is “no.” We would be in a better position to decide if the temperature rise of the past century has been natural if we could extend the record further back in time. Unfortunately, direct temperature measurements of sufficient accuracy or geographic coverage simply didn’t exist before the mid-1800s. But by carefully considering other quantities that do depend on temperature, paleo-climatologists can reconstruct approximate temperature records that stretch back hundreds, thousands, and even millions of years.
The figure Variations of the Earth's surface temperature (b) shows the results of a remarkable study (see Mann, Bradley, and Hughes, 1998 and Mann, Bradley, and Hughes, 1999), that attempts to push the Northern Hemisphere temperature record back a full 1,000 years. To produce this, climatologist Michael Mann and his colleagues performed a complex statistical analysis involving some 112 separate indicators related to temperature. These included such diverse factors as tree rings, the extent of mountain glaciers, changes in coral reefs, sunspot activity, volcanism, and many others. The resulting temperature record of Variations of the Earth's surface temperature (b) represents a “reconstruction” of what one might expect if thermometer-based measurements had been available. Although there is considerable uncertainty in each year of the millennial temperature reconstruction, as shown by the error band in Variations of the Earth's surface temperature (b), the overall trend shows a gradual temperature decrease over the first 900 years, followed by a sharp upturn in the twentieth century. That upturn is, of course, a compressed representation of the “real” (thermometer-based) temperature record shown in Variations of the Earth's surface temperature (a). Among other things, Variations of the Earth's surface temperature (b) suggests that the decade of the 1990s was not only the warmest of the century, but of the entire millennium. Taken in the context of Variations of the Earth's surface temperature (b), the temperature rise of the last century is clearly an anomaly. These results have been verified, re-verified, and fine-tuned in subsequent papers by Mann and his colleagues, including Mann (2000), Mann (2001), Mann (2002), Mann (2004), and Jones and Mann (2004) -- discussed again below. Many other scientists have come to similar conclusions, using similar and varying methods, including Jones, Osborn, and Briffa (2001), Duffy et al. (2001), and Bradley (2003). The figure below, Various reconstructions of temperature over the last 1000-2000 years, shows Bradley's aggregation of temperature data compiled by a multitude of scientists in different studies. It shows what not only Mann, but many others, have repeatedly shown: that a twentieth century temperature increase is detectable.
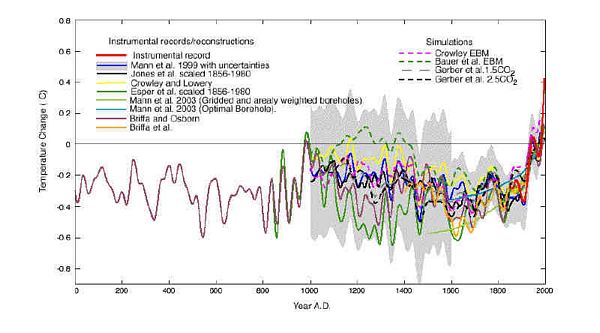
Figure — Various reconstructions of temperature over the last 1000-2000 years, relative to the reference period 1961-90. All reconstructions have been scaled to the annual, full Northern Hemisphere mean, over an overlapping period (1856-1980), using the NH instrumental record [Jones et al, 1999] for comparison, and have been smoothed on time scales of >40 years to highlight the long-term variations. The smoothed instrumental record (1856-2000) is also shown (from Mann et al., 2003). (Source: Bradley, 2003)
A few "contrarian" scientists have challenged this conclusion (i.e., the "hockey stick"), as discussed below in Contrarians.
It is likely that human activities have caused a discernible impact on observed warming trends
The figure Global mean radiative forcing summarizes our best understanding up to 2001 of radiative forcings due to greenhouse gases, aerosols, land-use changes, solar variability, and other effects since the start of the industrial era. Even if the negative forcings (cooling) from some of these anthropogenic changes reach the high ends of their proposed ranges (see figure, Global mean radiative forcing), they might be insufficient to offset much of the warming due to anthropogenic greenhouse gases after a few more decades. This is because the effects of cooling aerosols are short-lived and geographically localized relative to the long-term, global effects of the well-mixed greenhouse gases, and these health-damaging aerosols are likely to be controlled. The most advanced climate models are driven by a range of plausible assumptions for future emissions of all types, and make it clear that the overall effect of human activity on the atmosphere is almost certainly a net positive forcing — anthropogenic warming (see the figure Models of Earth's temperature below). However, very recently, data on black carbon aerosols has added more uncertainty (see Jacobson, 2002; Jacobson, 2004; Novakov et al., 2003; and Hansen and Nazarenko, 2004).
Figure — Models of Earth's temperature since 1860 (source: IPCC, Working Group I, Summary for Policy Makers, figure SPM-2).
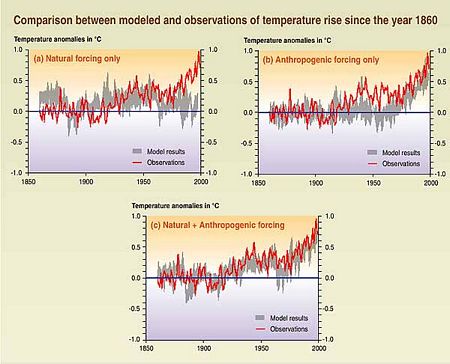
Taken together, the figures Indicators of human influence and Variations of the Earth's surface temperature show a high correlation between increases in global temperature and increases in carbon dioxide and other greenhouse gas concentrations during the era, from 1860 to present, of rapid industrialization and population growth. But, as the cliché phrase goes, correlation is not necessarily causation. So, are anthropogenic CO2 emissions a direct cause of recent warming? As the data summarized in Models of Earth's temperature since 1860 suggests, it looks increasingly like the answer is “yes.” But the connection between the past 140 years' warming and the coincident rise in CO2 is not so straightforward. For example, global temperature actually declined in the period after World War II, a time of rapid industrialization (and, therefore, increasing CO2 concentrations). On the other hand, the temperature rise should lag CO2 increases by some decades, so we shouldn’t expect to find that recent temperature and CO2 are instantly correlated. Moreover, there are other factors that can influence climate fluctuations or trends, and all of these are confounded in the record we observe in Indicators of human influence and Variations of the Earth's surface temperature.
Separating the anthropogenic “signal” of climate change from the “noise” of natural fluctuations can be a tricky process, especially since that noise involves an unpredictable component of internal oscillations called “stochastic noise” and a component that may be forced by natural causes such as changes in the output of the sun or volcanic dust veils — called “natural forcings”. Models of Earth's temperature since 1860 shows the model-generated projections with and without several of these elements, and suggests, as noted, that the best results are obtained from a combination of natural and anthropogenic forcings. Although substantial, this is still circumstantial evidence.
The methods used to attribute some observed warming trends to humans are often called “fingerprint analysis.” The most well-known use of this type of analysis is usually attributed to Ben Santer, a physicist and atmospheric scientists at the Program for Climate Model Diagnosis and Intercomparison at the Lawrence Livermore National Laboratories in Berkeley, California (see, for example, Santer et al., 1993 and Santer et al., 2003). Although each "fingerprint" may be a circumstantial piece of evidence of human-induced climate changes (as is Models of Earth's temperature since 1860), taken together, several such lines of evidence led the IPCC (2001) to conclude that there is even stronger evidence of a human signal in data collected in the past five years than there was in 1995, when the IPCC concluded that a human fingerprint was already discernible (“There is new and stronger evidence that most of the warming observed over the last fifty years is attributable to human activities.”; see Working Group I Summary for Policy Makers, P. 10). One sign of a human fingerprint is the fact that the Earth's stratosphere has cooled while the surface has warmed — a sign of greenhouse gas forcing and ozone depletion rather than a naturally-occurring increase in the heat output of the sun, which would warm all layers of the atmosphere. The latter natural forcing is often claimed by so-called “contrarian” scientists to be responsible for the bulk of the observed warming, as discussed in Contrarians, below.
Other human fingerprints include the probabilities from models that higher latitudes will warm more than lower latitudes and land will warm more than oceans: all these model-based projections have been reflected in observed trends. The figures Decadal Temperature Trends and Variations of the Earth's surface temperature below support this.
Figure — Decadal Temperature Trends: 1976 to 2000 (source: Intergovernmental Panel on Climate Change, Synthesis Report, figure 2-6b).
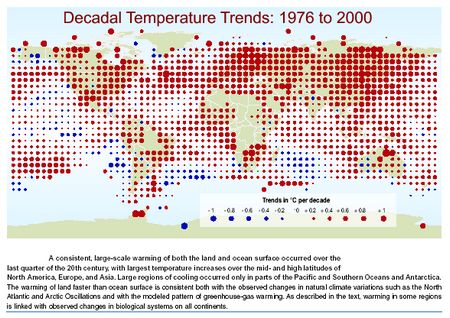
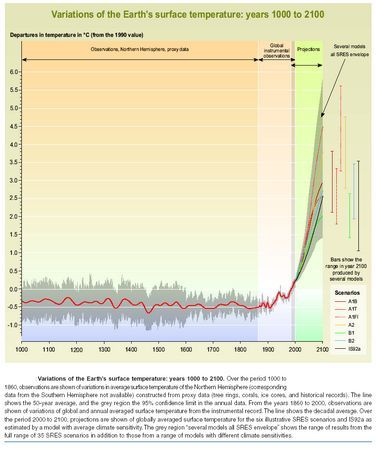
Figure — Variations of the Earth's surface temperature: years 1000 to 2100 (source: IPCC, Synthesis Report, figure SPM-10b).
Another technique, known as “optimal fingerprinting,” has been studied extensively and reported in the scientific literature (see the Hadley Center — “Is humankind already changing global climate?”, “Causes of twentieth-century temperature change near the Earth's surface”, and Forest et al., 2001). Such studies cautiously declare that a human fingerprint is, indeed, discernible in observations. This careful and thorough peer-reviewed science is in stark contrast to the shrill claims that humans have not caused the recent warming; claims that can be found in many opinion pieces written by non-climatologists (see, e.g., Robinson and Robinson in a 1997 Wall Street Journal editorial; also see “Mediarology”and "Contrarians"). One of the most in-depth analyses of temperature changes over the last few millennia, the anomalous warming of the past few decades, and the human contributions to it was performed by Jones and Mann (2004). In addition to reaffirming their earlier conclusions that warming of the late 20th Century is indeed anomalous and unprecedented, they reiterate and build upon past findings that indicate that whereas 19th Century temperature trends can be explained well by natural factors, the warming of the late 20th Century can only be well-explained when anthropogenic forcing is taken into account.
It is imperative that better quantitative estimates of what both human and natural radiative forcings have been over the past 50 years are obtained so that we increase our quantitative capacity in order to estimate precisely how much human activities have influenced climate and improve our confidence in projections of how much more warming the Earth is likely to experience. Although some uncertainty remains, it does not detract from the large body of scientific evidence that shows a clear, discernible influence of human activities on recent climate records and expects substantially greater amounts of climate change if human emissions continue at rates typically projected.
A very unique attribution study has been conducted by Ruddiman, 2003. Ruddiman's report, titled "The Anthropogenic Greenhouse Era Began Thousands of Years Ago," was quite revolutionary in its thinking. As the title implies, Ruddiman believes that atmospheric concentrations of CO2 and CH4 were first altered by humans -- yep, you guessed it -- thousands of year ago, resulting from the discovery of agriculture and subsequent technological innovations in farming. While Ruddiman admits that this is still no more than a hypothesis, it is based on three strong pieces of evidence (much of which is quoted as written in Ruddiman's abstract):
- Cyclic variations in CO2 and CH4 driven by Earth-orbital changes during the last 350,000 years predict decreases throughout the Holocene, but the CO2 trend began an anomalous increase 8,000 years ago, and the CH4 trend did so 5,000 years ago. If the declines had continued, there likely would have been another Ice Age 4,000 to 5,000 years ago, but the reversal prevented that from occurring.
- Published explanations for these mid- to late-Holocene gas increases based on natural forcing can be rejected based on paleoclimatic evidence.
- A wide array of archaeological, cultural, historical, and geologic evidence points to viable explanations tied to anthropogenic changes resulting from early agriculture in Eurasia, including the start of forest clearance by 8,000 years ago (beginning in Europe, China, and India to clear room for croplands and pastures) and of rice irrigation by 5,000 years ago (mainly in Southeast Asia).
Ruddiman analyzed the Pleistocene CO2 record (something with which he is very familiar from past studies) by looking at the Vostok ice core and came to the conclusion that the interglacial life cycle of CO2 in the present interglacial has varied from the other three interglacials occurring in the last 400,000 years. In typical interglacials, CO2 peaks early and then stabilizes or decreases, but in the Holocene interglacials, CO2 levels fell early on and then began to recover. Ruddiman believes the main difference between this abnormal interglacial and the others is the presence of land clearing and agriculture. He point to two ways in which land clearing typically increases CO2 concentrations: burning and decomposition of downed vegetation and increased weathering of soil carbon in a system that has been disturbed (i.e., tilled). These forces, Ruddiman believes, warmed the Earth by a global mean of about 0.8°C in recent millennia (2°C at higher latitudes) and have contributed to an uncharacteristically stable 10,000 years. In addition, Ruddiman believes CO2 changes during the last millennium cannot be explained by external factors but rather by forest regrowth following episodes of bubonic plague (when less agriculture was done), which, among other similar factors, were responsible for the Little Ice Age (1300-1900 AD). (For a brief summary of the paper, see a New York Times article, "Scientist Links Man to Climate Over the Ages".)
Two editorial comments appeared alongside Ruddiman's paper in the December 2003 issue of Climatic Change (see Crowley, 2003 and Crutzen and Steffen, 2003). Crowley believes that Ruddiman may be on to something clever, but that his estimate of 0.8°C of warming caused by greenhouse perturbation due mainly to agriculture may be high. It is on the upper end of climate sensitivity estimates, and a "best guess" would likely be closer to 0.3 to 0.4°C, according to Crowley. Crowley also believes that solar variability and volcanism cannot be written off, as they are thought to influence temperature and are thought to be responsible for much of the warming that occurred up to the time of the Industrial Revolution. Crutzen and Steffen also agree that there could have been an anthropogenic component to warming thousands of years ago, and they suggest that perhaps the period Ruddiman identifies is the first phase of the "Anthropocene" out of four phases (the fourth is expected to develop this century). They, too, warn that there are many unresolved uncertainties in Ruddiman's work (i.e., they point out that much of his argument is based on the correctness of the historical CH4 concentration curve, which may or may not be correct). Clearly this issue is ripe for additional research.
Is land use change contributing to the observed climate trends, as Ruddiman suggests? It has been known for decades that a number of forcings, both natural and anthropogenic, can cause climate change (e.g., see the table from my 1984 book, The Co-Evolution of Climate and Life). Two decades ago, in the table just mentioned, I had an entry "Patterns of land use", which listed the climatic effects as "Changes surface albedo and evapotranspiration and causes aerosols", in which the scale and importance of the effect was described as "Largely regional: net global climatic importance still speculative". I think that is pretty close to what I would still say today, but at least in the past several years, there have been both modeling (see Pielke Sr. et al., 2002) and observational (see Kalnay and Cai, 2003, critiques by Trenberth, 2004 and Vose et al., 2004, and a subsequent response, mainly directed at Vose et al., by Cai and Kalnay) studies suggesting that land use may have played a major role over the long term (to say nothing of the Ruddiman hypothesis). For example, it is well known that clearing land raises albedo but lowers evapotranspiration. The first process cools the Earth's surface, and the second warms it, but together they still cool the planet unless feedbacks negate that. This is why the role of land use change is still largely speculative — there are many interactions and feedbacks to be considered. Also, the dramatic rise in temperatures in the past thirty years would be much harder to explain using a land use change explanation than the overall rise over the past hundred years would be, since land use has not changed dramatically over the last few decades compared to century-long trends. Moreover, land covers only thirty percent of the planet, and it is questionable as to whether it has as much influence in the grand scheme of things relative to truly global forcings like greenhouse gases (unless it forces changes in greenhouse gases as Ruddiman projects). But as I said twenty years ago about aerosols (see the Coevolution table), their climatic effects are "largely regional, since aerosols have an average lifetime of only a few days, but similar regional effects in different parts of the world could have nonnegligible net global effects." That is also true for land use, unless it makes big changes in greenhouse gases. In addition, land use change can have major impacts on plants and animals, and the synergism of climate change and forced migration of wildlife through disturbed landscapes could be a prescription for many extinctions (see Climate Impacts).
I reproduce this 20-year-old table to show that we do make progress, albeit halting, with research. Today, I would put more emphasis on aerosols' role in cooling rather than in warming, although the soot issue is challenging that revision (see Hansen and Nazarenko, 2004; Hansen et al., 2000; Hansen and Sato, 2000; Jacobson, 2002; Jacobson, 2004; Novakov et al., 2003; and Black Carbon Contributes To Droughts And Floods In China). We also know that the decline in stratospheric ozone levels has a weak cooling effect at the Earth's surface. But, amazingly, most of what we knew twenty years ago is still in line with today's assessments.
Table — Summary of Principal Human Activities That Can Influence Climate Change (presented as a background document against which to compare modern conditions) (Source: Schneider and Londer, 1984)
| | | |
| Release of carbon dioxide by burning fossil fuels | Increases the atmospheric absorption and emission of terrestrial infrared radiation (greenhouse effect), resulting in warming of lower atmosphere and cooling of the stratosphere. | Global: potentially a major influence on climate and biological activity. |
| Release of chlorofluoromethanes, nitrous oxide, carbon tetrachloride, carbon disulfide | Similar climatic effect as that of carbon dioxide since these, too, are infrared-absorbing and fairly chemically stable trace gases. | Global: potentially significant influence on climate. |
| Release of particles (aerosols) from industrial and agricultural practices | These sunlight scattering and absorbing particles probably decrease albedo over land, causing a warming and could increase albedo over water, causing a cooling; they also change stability of lower atmosphere; net climatic effects still speculative. | Largely regional, since aerosols have an average lifetime of only a few days, but similar regional effects in different parts of the world could have nonnegligible net global effects; stability increase may suppress convective rainfall, but particles could affect cloud properties with more far-reaching effects. |
| Release of aerosols that act as condensation and freezing nuclei | Influences growth of cloud droplets and ice crystals; may affect amount of precipitation or albedo of clouds in either direction. | Local (at most) regional influences on quantity and quality of precipitation, but unknown and potentially important change to earth's heat balance if cloud albedo is altered. |
| Release of heat (thermal pollution) | Warms the lower atmosphere directly. | Locally important now; could become significant regionally; could modify large-scale circulation. |
| Upward transport of chlorofluoromethanes and nitrous oxide into the stratosphere | Photochemical reaction of their dissociation products probably reduces stratospheric ozone. | Global but uncertain influence on climate: less total stratospheric ozone probably allows more solar radiation to reach the surface but compensates by reducing greenhouse effect as well; however, if ozone concentration decreases at high altitudes, but increases comparably at lower altitudes, this would lead to potentially very large surface warming; could cause significant biological effects from increased exposure to ultraviolet radiation if total column amount of ozone decreases. |
| Release of trace gases (e.g., nitrogen oxides, carbon monoxide, or methane) that increase tropospheric ozone by photochemical reactions | Large atmospheric heating occurs from tropospheric ozone, which enhances both solar and greenhouse heating of lower atmosphere. | Local to regional at present, but could become a significant global climatic warming if large-scale fossil fuel use leads to combustion products that significantly increase tropospheric ozone levels; contact with ozone also harms some plants and people. |
| Patterns of land use, e.g., urbanization, agriculture, overgrazing, deforestation, etc. | Changes surface albedo and evaporotranspiration and causes aerosols. | Largely regional: net global climatic importance still speculative. |
| Release of radioactive Krypton-85 from nuclear reactors and fuel reprocessing plants | Increases conductivity of lower atmosphere, with possible implications for earth's electric field and precipitation from convective clouds. | Global: importance of influence is highly speculative. |
| Large-scale nuclear war. | Could lead to very large injections of soot and dust causing transient cooling lasting from weeks to months, depending on the nature of the exchange and on how many fires were started. | Could be global, but initially in mid-latitudes of Northern Hemisphere. Darkness from dust and smoke could wipe out photosynthesis for weeks with severe effects on both natural and agricultural ecosystems of both combatant and noncombatant nations. Transient freezing outbreaks could eliminate most warm season crops in mid-latitudes or be devastating to any vegetation in tropics or subtropics. |
It is likely that human emissions of greenhouse gases will continue to increase substantially
Most climatologists agree that humans' contributions to global warming will rise in the future, regardless of the resolution of the new aerosol debate. In order to project future global warming, it is first necessary to construct scenarios detailing human disturbances to radiative forcing, considering such factors as increased greenhouse gas emissions, aerosol injections, or land use changes. These then drive climate models to project future changes, which in turn are used by the climate impacts community (see Climate Impacts) to estimate and emphasize the benefits of mitigating such anthropogenic climate changes. As noted earlier, the SRES produced a range of plausible, alternative future worlds from which emission scenarios are derived and used in climate models to project alternative future climates (see Using scenarios to develop a plausible range of outcomes).