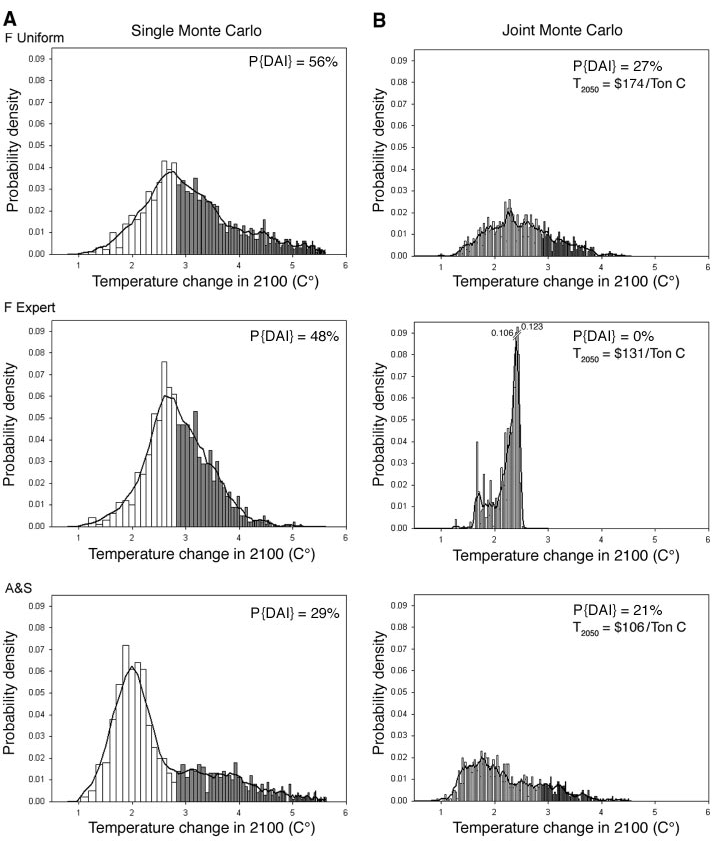
Figure — Probability distributions . (A) Probability distributions for each climate sensitivity distribution for the climate sensitivity – only Monte Carlo analyses with zero damages and 0% PRTP (a 1% discount rate). (B) Probability distributions for the joint (climate sensitivity and climate damage) MC analyses. All distributions display a 3-bin running mean and the percentage of outcomes above our median threshold of 2.85°C for dangerous climate change, P{DAI[50‰]}. The joint distributions display carbon taxes calculated in 2050 (T2050) by the DICE model, using the median climate sensitivity from each climate sensitivity distribution and the median climate damage function for the joint Monte Carlo cases (19). When we compare the joint cases with climate policy controls (B) to the climate sensitivity – only cases without climate policy controls (A), sufficient carbon taxes reduce the potential (significantly in two out of three cases) for DAI[50‰]. (Source: Mastrandrea and Schneider, 2004.)