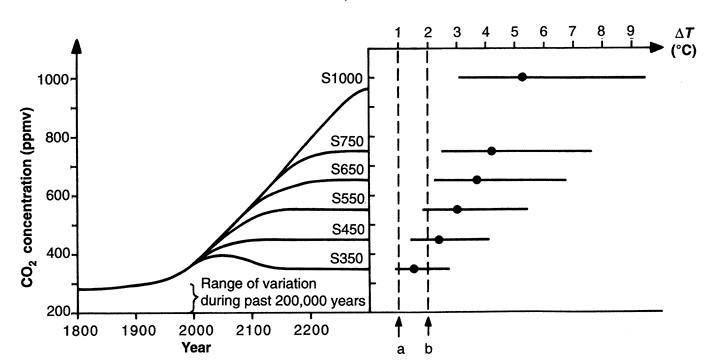
Figure — Left: IPCC stabilization scenarios for atmospheric CO2. Right: Corresponding equilibrium changes in global mean temperature since pre-industrial times (central values plus uncertainty ranges from IPCC (1996a). Other greenhouse gases and aerosols combined have been assumed to add 1 W/m2. The dashed vertical lines denote (a) the estimated range of variability of the change between in global mean temperature during the past 1000 years and (b) the 2oC temperature considered as a long run climate policy target by the European Union. A temperature increase by 5-7oC corresponds to the sustained average change in global average surface temperature that takes place during the transition from an ice age to an interglacial. Source: Azar & Rodhe (1997).